-
Analytics
-
Demographics
-
Rent Comps
-
Sale Comps
-
Expense Comps
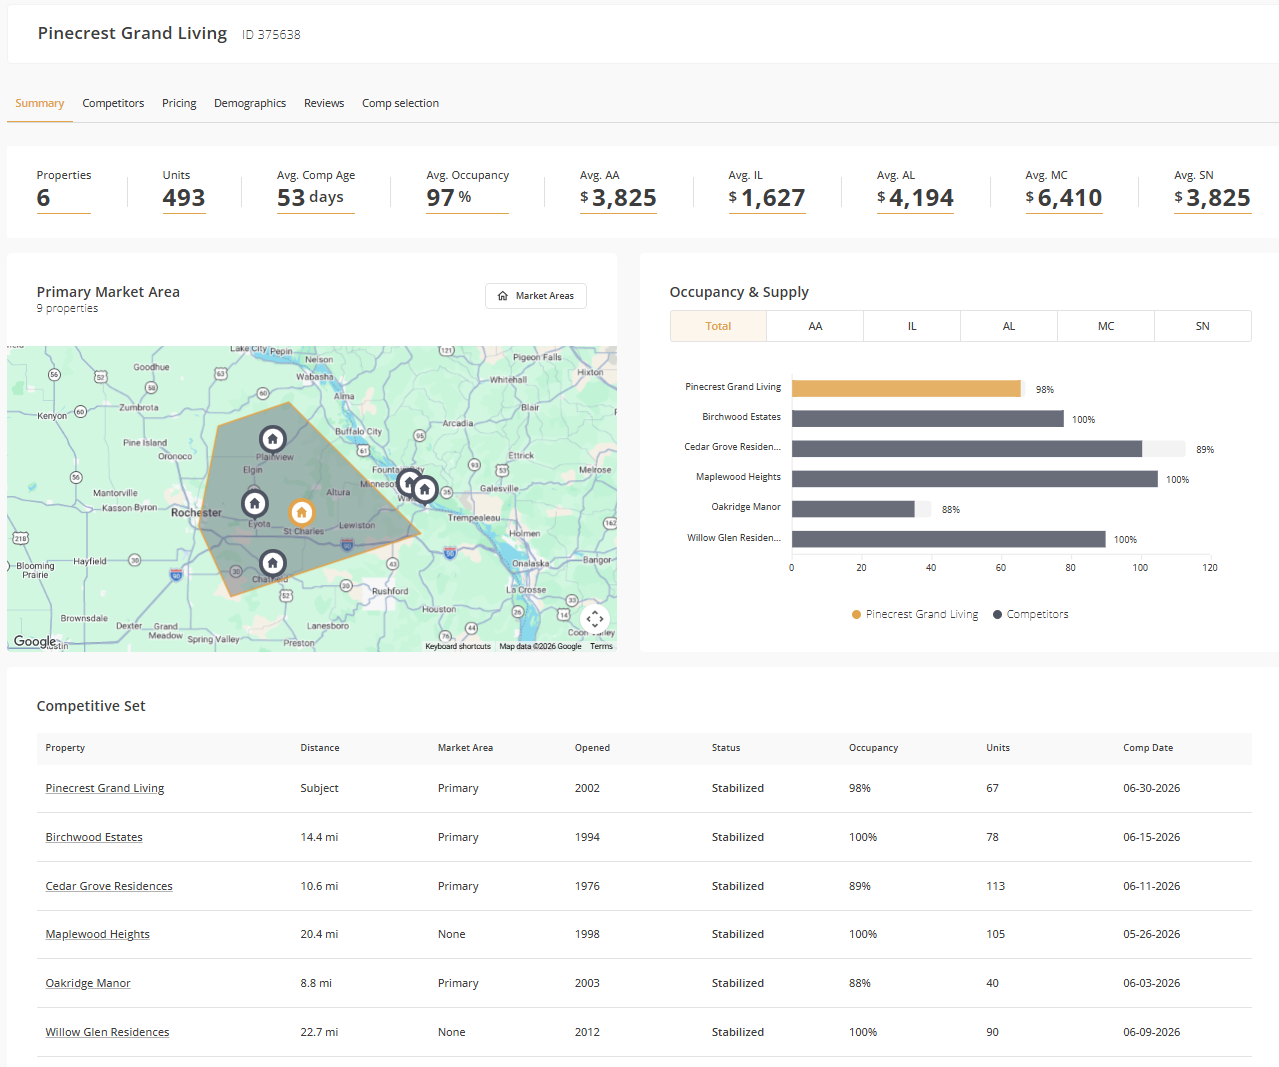
Turn property and portfolio data into decision-ready dashboards. Benchmark assets against their competitors, identify pricing and occupancy opportunities, and see where performance can be improved. Dashboards include:
 Asset & Portfolio-Level Benchmarking
- Pricing & Occupancy Comparisons
- Competitive Positioning
- Asset Performance Trends
- Comp-Set Comparisons
- Market-Level Insights
- Opportunities & Outliers
- And much more
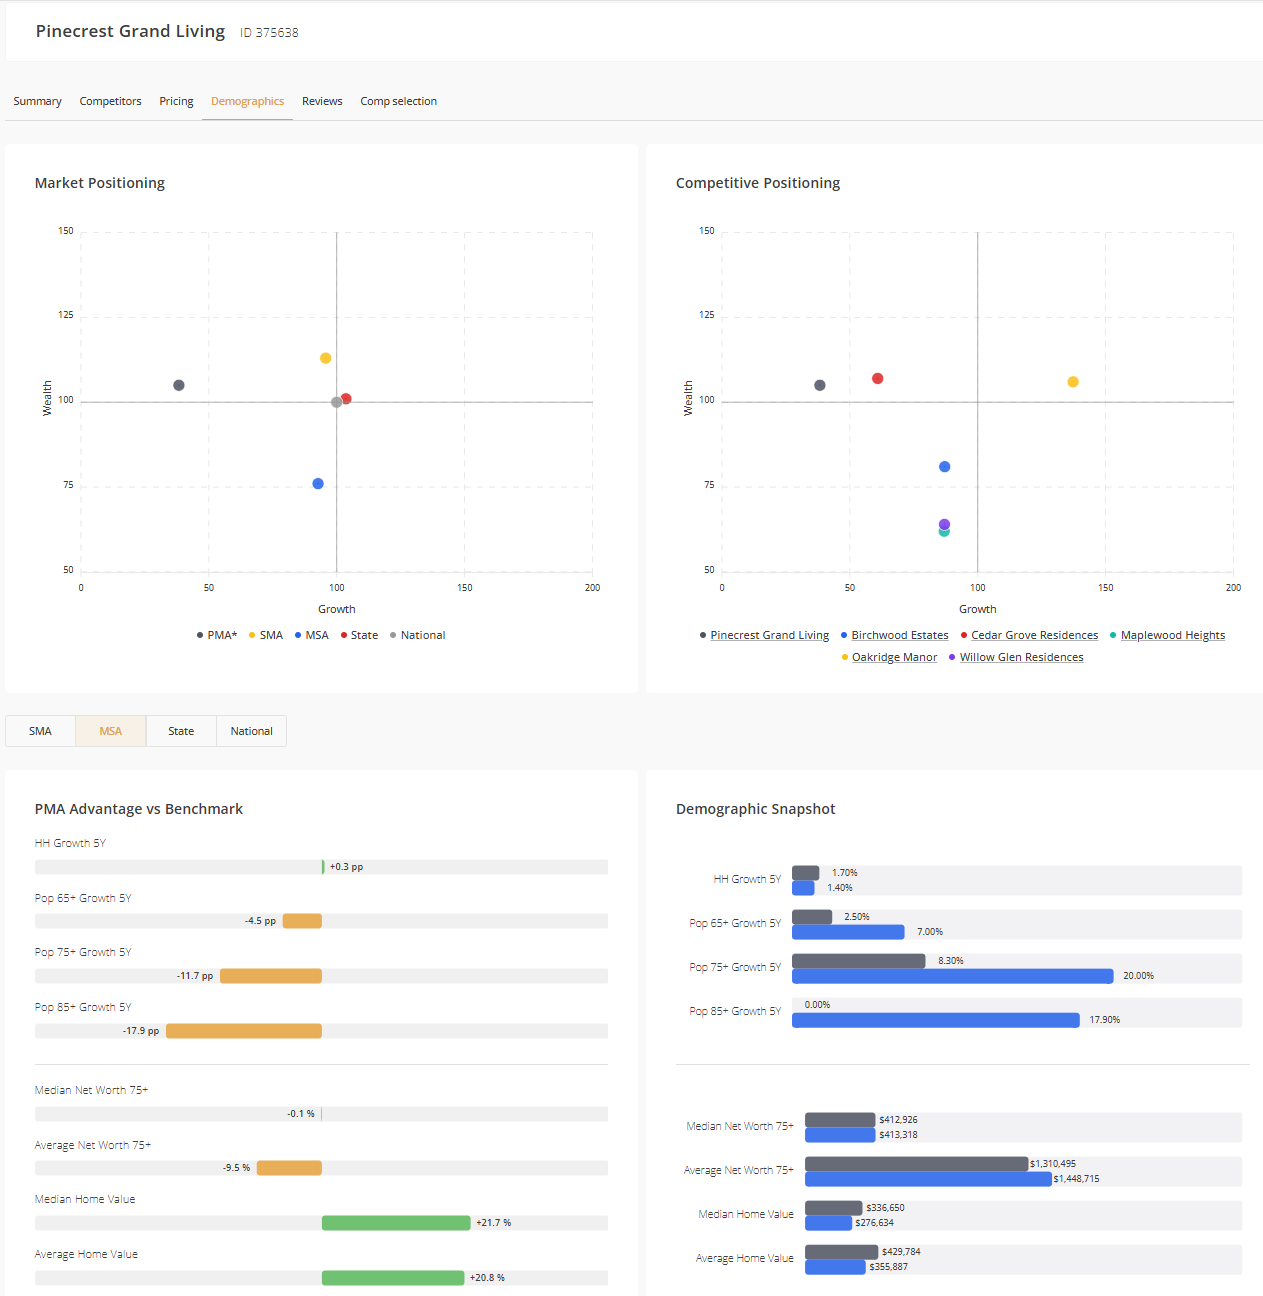
Create custom market areas to analyze senior population trends, household wealth, demand growth, and competitive supply. Compare locations, evaluate development opportunities, and support market-level decisions with reports that include:
- Custom Market Areas
- Senior Population by Age
- Income, Net Worth & Home Values
- Existing & Proposed Supply
- Market Benchmarking
- Demand Indicators
- And much more
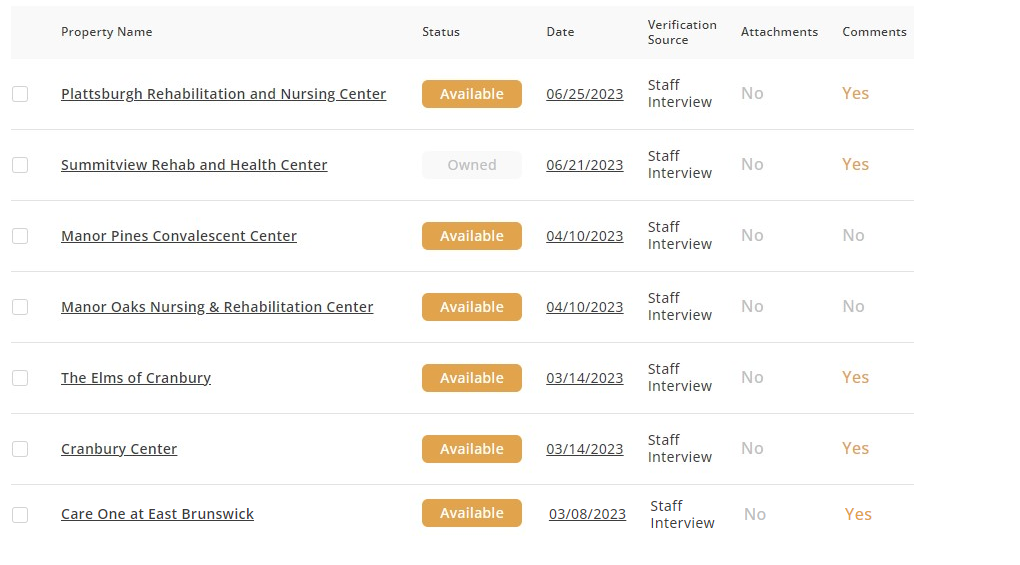
Gone are the days of relying upon aggregated data. Get instant access to the specific, property-level pricing and occupancy data that you need. Profiles include:
- Rental Rates
- Occupancy
- Payor Mix
- Unit Mix & Sizes
- Property Photo
- Detailed Notes
- And much more
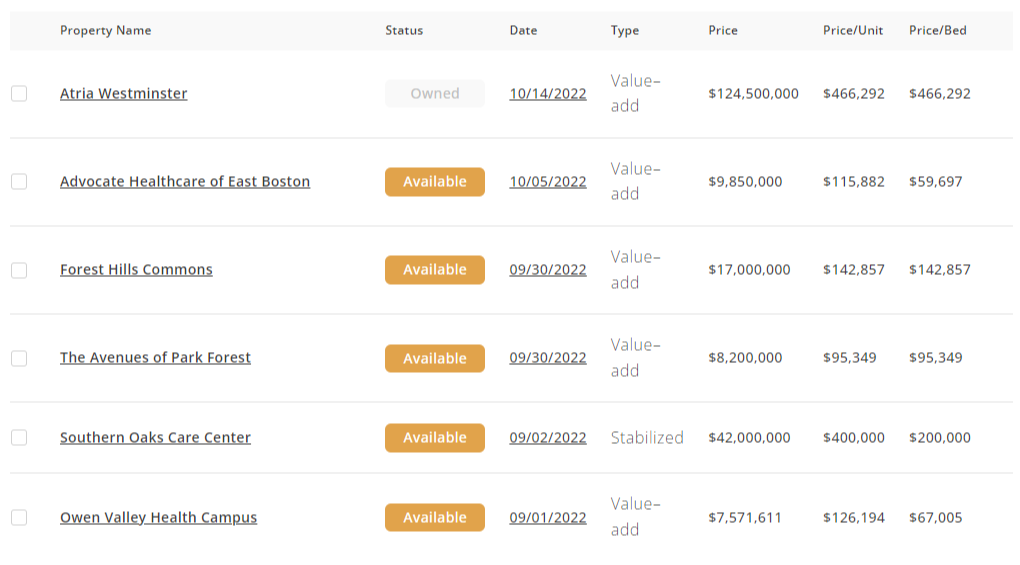
Quickly get the latest sales that others already spent the time researching and verifying. Search by property name, price per unit, cap rate, location, and more. Profiles include:
- Transaction Price
- Price Per Unit/Bed
- Cap Rate
- EGIM
- Buyer & Seller
- Transaction Notes
- And much more
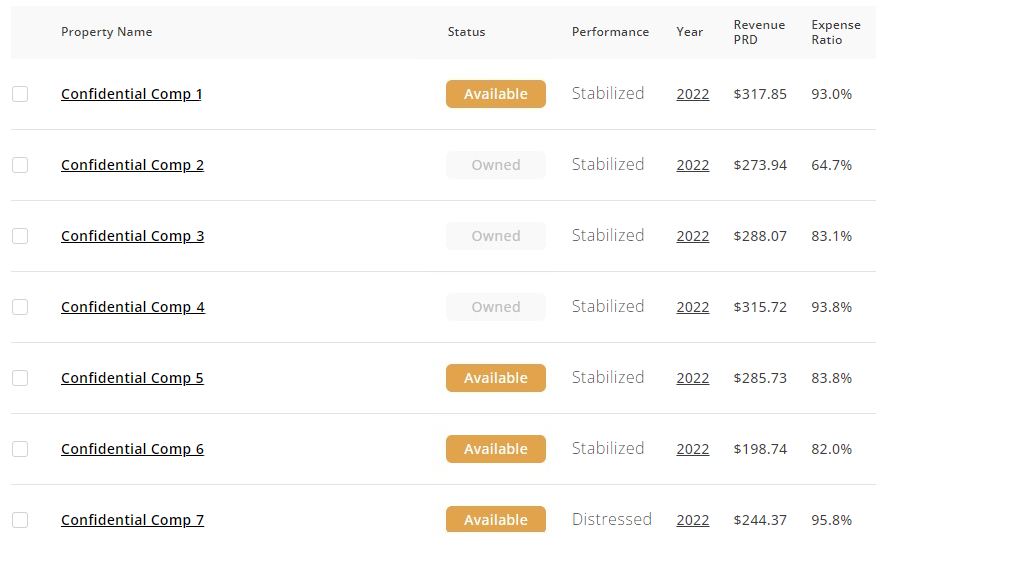
Benchmark your property's P&L against similar properties to see how profitability can be improved. Compare by state, market size, revenue rates, expense levels, and more. Profiles include:
- Geographic Area
- Property Type & Size
- Occupancy Rate
- Revenue & Expenses
- Payroll vs. Non-Payroll
- Stabilization Status
- And much more
-
Analytics
-
Demographics
-
Rent Comps
-
Sale Comps
-
Expense Comps
Turn property and portfolio data into decision-ready dashboards. Benchmark assets against their competitors, identify pricing and occupancy opportunities, and see where performance can be improved. Dashboards include:
- Asset & Portfolio-Level Benchmarking
- Pricing & Occupancy Comparisons
- Competitive Positioning
- Asset Performance Trends
- Comp-Set Comparisons
- Market-Level Insights
- Opportunities & Outliers
- And much more
Create custom market areas to analyze senior population trends, household wealth, demand growth, and competitive supply. Compare locations, evaluate development opportunities, and support market-level decisions with reports that include:
- Custom Market Areas
- Senior Population by Age
- Income, Net Worth & Home Values
- Existing & Proposed Supply
- Market Benchmarking
- Demand Indicators
- And much more
Gone are the days of relying upon aggregated data. Get instant access to the specific, property-level pricing and occupancy data that you need. Profiles include:
- Rental Rates
- Occupancy
- Payor Mix
- Unit Mix & Sizes
- Property Photo
- Detailed Notes
- And much more
Quickly get the latest sales that others already spent the time researching and verifying. Search by property name, price per unit, cap rate, location, and more. Profiles include:
- Transaction Price
- Price Per Unit/Bed
- Cap Rate
- EGIM
- Buyer & Seller
- Transaction Notes
- And much more
Benchmark your property's P&L against similar properties to see how profitability can be improved. Compare by state, market size, revenue rates, expense levels, and more. Profiles include:
- Geographic Area
- Property Type & Size
- Occupancy Rate
- Revenue & Expenses
- Payroll vs. Non-Payroll
- Stabilization Status
- And much more

One operating view of every market you compete in.
- Price faster, spot opportunities, and stay ahead
- Benchmark pricing and occupancy property by property
- Identify communities with room to move rates
- Keep regional teams working from consistent data

See whether the operating story matches the market.
- Underwrite with property-specific evidence
- Test proforma rents against real competitors
- Review comps and operator performance
- Benchmark opportunities across a pipeline

Put supply, demand and competitor evidence in one place.
- Compare sites before capital is committed
- Build a custom market area around each site
- Compare senior growth, wealth, and existing supply
- Export a defensible market package to Excel

Research, organize and export without rebuilding the wheel.
- Start with better data and deliver faster
- Search the network and fill gaps in your own database
- Keep deal-specific comp sets and research history
- Push clean data into custom Excel templates

Size deals accurately and tighten underwriting.
- Know the market behind every loan
- Reduce the time it takes to size new deals
- Evaluate deal risk with access to local comps
- See what comps were missed by the sponsor or third parties